MARKET BASKET ANALYSIS USING APRIORI ALGORITHM
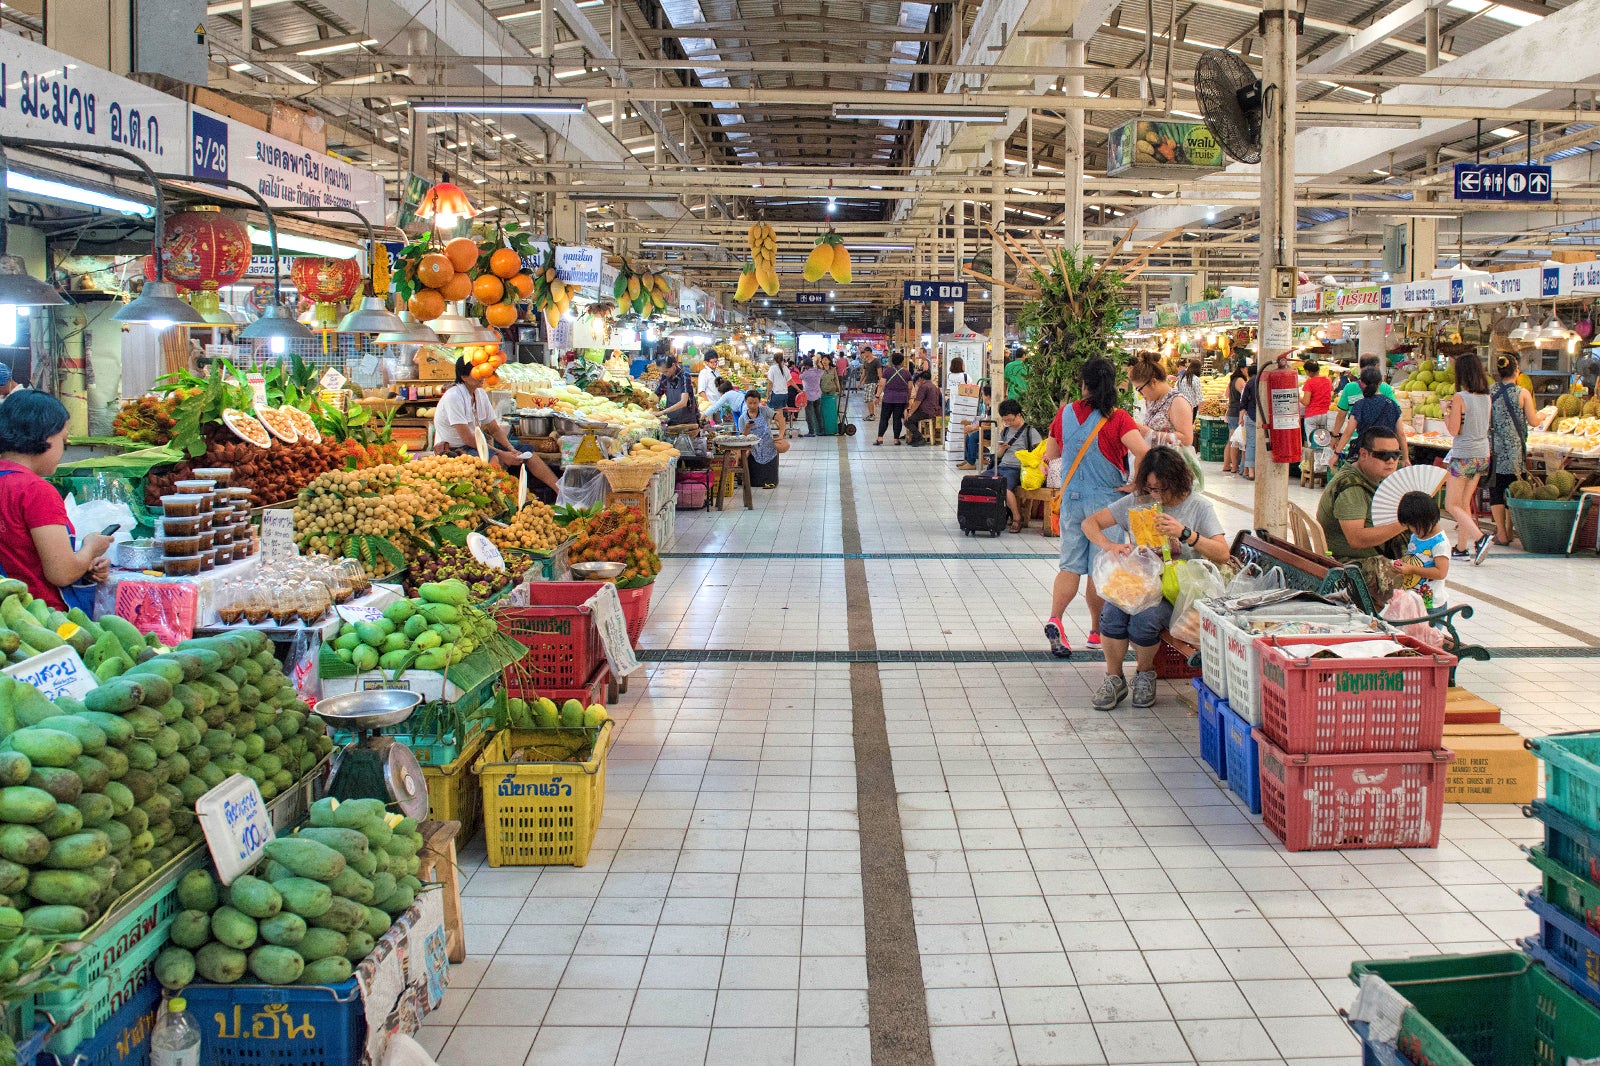
In the business intelligence world, “market basket analysis” helps retailers better understand – and ultimately serve – their users by predicting their purchasing behaviors.
In the retail and restaurant businesses, market basket analysis (MBA)
is a set of statistical affinity calculations that help managers better
understand – and ultimately serve – their customers by highlighting
purchasing patterns. In simplest terms, MBA shows what combinations of
products most frequently occur together in orders. These relationships
can be used to increase profitability through cross-selling,
recommendations, promotions, or even the placement of items on a menu or
in a store.
Market basket analysis uses association
rule mining under the hood to identify products frequently bought
together. Before we get into the nitty gritty of market basket analysis,
let us get a basic understanding of association rule mining. It finds
association between different objects in a set. In the case of market
basket analysis, the objects are the products purchased by a customer
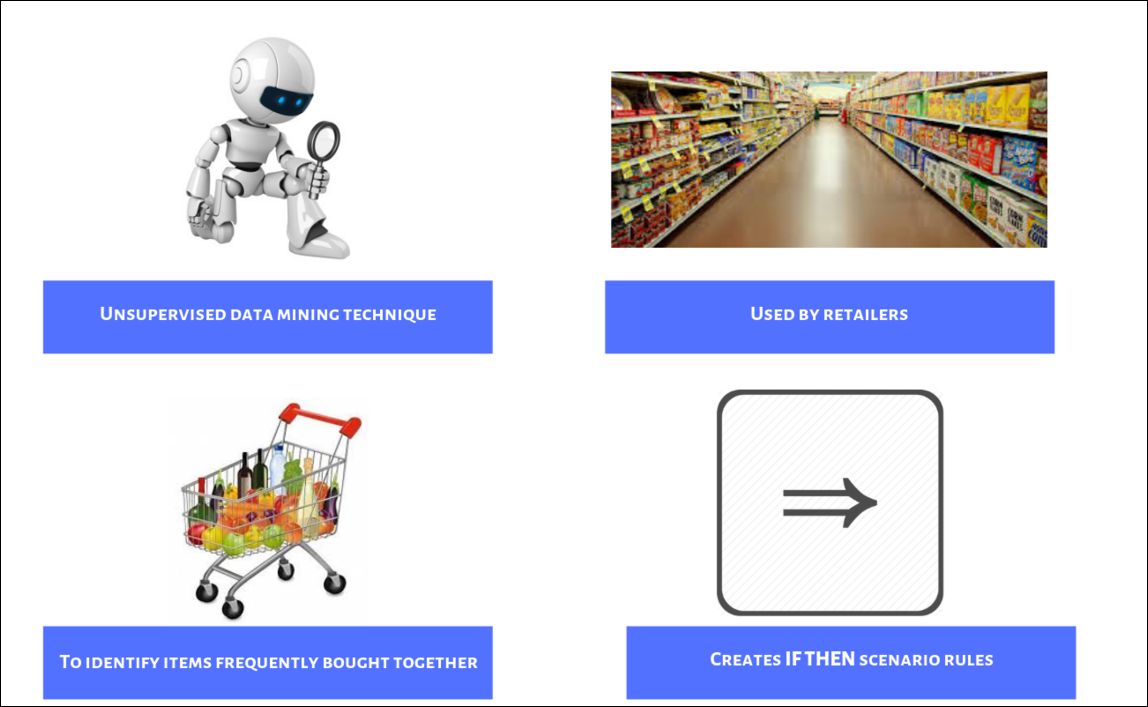
and the set is the transaction. In short, market basket analysis
- is a unsupervised data mining technique
- that uncovers products frequently brought together
- and creates if-then scenario rules
I did my internship on "Market Basket Analysis using Apriori Algorithm" from suven consultants under the guidance of ROCKY JAGTIANI.
Well know let us begin with the analysis of Market Basket it is divided into two important parts that is
- ASSOCIATION RULE MINING
- APRIORI ALGORITHM
ASSOCIATION RULE MINING:
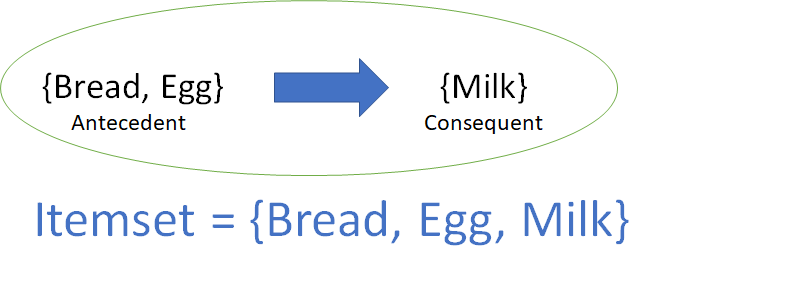
Association rule learning is a rule-based machine learning method for discovering interesting relations between variables in large databases. It identifies frequent if-then associations called association rules
which consists of an antecedent (if) and a consequent (then).Basket Data Analysis (or Market Basket Analysis) in retailing, clustering and classification.
An antecedent is something that’s found
in data, and a consequent is an item that is found in combination with
the antecedent. This key technique is used by large retailers like Amazon,
Flipkart and and many others to analyze costumers buying habits by finding association
between different
items that customers place in their “shopping baskets”. The discovery
of these associations can help retailers develop marketing strategies by
gaining insight into which items are frequently purchased together by
customers. The strategies may include:
- Changing the store layout according to trends
- Customer behavior analysis
- Catalog design
- Cross marketing on online stores
- What are the trending items customers buy
- Customized emails with add-on sales etc..
DIFFERENCE BETWEEN ASSOCIATION AND RECOMMENDATION:
Association
rules do not extract an individual's preference, rather find
relationships between sets of elements of every distinct transaction.
This is what makes them different than Collaborative filtering which is
used in recommendation systems.
“Frequently Bought Together” → Association
“Customers who bought this item also bought” → Recommendation.
APRIORI ALGORITHM:

The above given flow chart is the exact implementation of Apriori Algorithm. Apriori
algorithm assumes that any subset of a frequent itemset must be
frequent. Its the algorithm behind Market Basket Analysis.
Apriori Algorithm uses various sets of rules we will be using the matrices to solve MARKET BASKET ANALYSIS. Let us take an example using the following image.
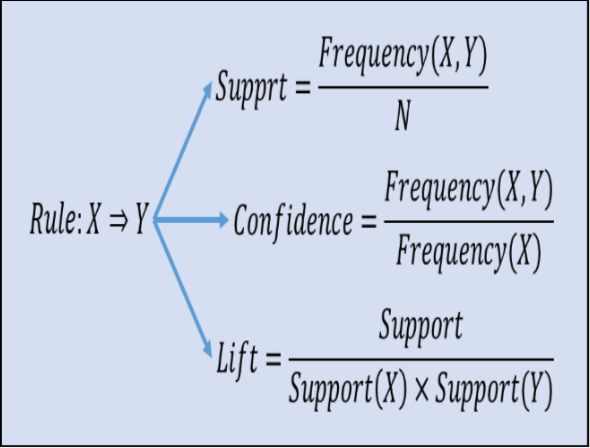
- SUPPORT: It is the ratio of transactions involving a particular item to the total number of transactions. It defines the popularity of an item. It ranges between 0 and 1. This measure gives an idea of how frequent an itemset is in all the transactions. Consider itemset1 = {bread} and itemset2 = {shampoo}. There will be far more transactions containing bread than those containing shampoo. So as you rightly guessed, itemset1 will generally have a higher support than itemset2. Now consider itemset1 = {bread, butter} and itemset2 = {bread, shampoo}. Many transactions will have both bread and butter on the cart but bread and shampoo? Not so much. So in this case, itemset1 will generally have a higher support than itemset2. Mathematically, support is the fraction of the total number of transactions in which the itemset occurs.
2. CONFIDENCE: It
is the ratio of number of transactions involving two items X and Y by
the number of transactions involving X. Therefore, it tells the
possibility of how often items X and Y occur together, given the number
of times X has occurred. It ranges between 0 and 1.

3. LIFT: Lift indicates certainty of a rule. How much sale of X has increased when B is sold?
Example: A => B [support = 5%, confidence = 80%]

To summarize the three parts into mathematical formula the image is given below:
IMPLEMENTATION:
While implementing on the machine learning model we have used a standard dataset
GROCERIES.CSV.
1. EXPLORATORY DATA ANALYSIS OVER THE DATA:
TO CHECK THE DATA SET SHAPE. 
FIND THE TOP 20 ITEMS THAT OCCUR IN THE DATA SET:

From the above EDA we can comment that Top 5 (whole milk, other vegetables, rolls/buns, soda, yogurt)Items are responsible to 21.74% to of the entire sale! and Top 20 Items are contributing 50.37% to the over all sale! in a supermarket.
2. PRUNE THE DATA SET:

Here length_trans=2 indicates that we are interested in transactions with at least two items
and their cumulative sales should account for 50% of the total sales.
This is a very good data set because it contains top 19 items and very good (effectively,
half) amount of rows/ transactions from the original data set. So, we will proceed with this.
3. APPLY APRIORI ALGORITHM AND OBTAIN RULES:

The above code is used to find one percent of the transactions in the because we have given min_support = 0.01 .

Support = 0.031163. This means that the itemset of Tropical Fruit, Whole Milk and Bottled Water show up together in 3.1% of transactions.
Confidence = 0.220472. If customer buys Tropical fruit & Whole Milk they will also buy Bottled Water 22.0% of the time.
Lift = 2.857132. Bottled Water are 2.85 times more likely to be purchased alongside Tropical Fruit & Whole Milk than they are relative to their general purchase rate
Lastly, we can adjust and tune the algorithm's parameters to generate many other different rules.
This
is a significant piece of information, as this can prompt a retailer to
bundle specific products like these together or run a marketing scheme
that offers discount on buying root vegetables along with these other
three products

gr8 start atharva !!
ReplyDeleteGreat Atharva. Keep it up
ReplyDeleteWell done!! Atharva,
ReplyDelete👍🏻
ReplyDeleteGreat work
ReplyDeleteWell done
ReplyDelete